
Numbers first
Revenue and deals won get the largest cards. Supporting metrics sit beside them at half the size, each with its change against last month.
Case study · Concept project
A lead and ad performance dashboard with an AI assistant
Kestrel is a concept for a marketing and lead dashboard, made for small teams that run ads on a few channels and need to know what is working today.
I designed it to answer one question fast: where are my leads coming from, and what should I do next? Everything on the screen either shows a number that matters or helps you act on it.
Most marketing dashboards show everything at the same volume. These are the five problems I designed against.
Revenue and deals won get the largest cards. Supporting metrics sit beside them at half the size, each with its change against last month.
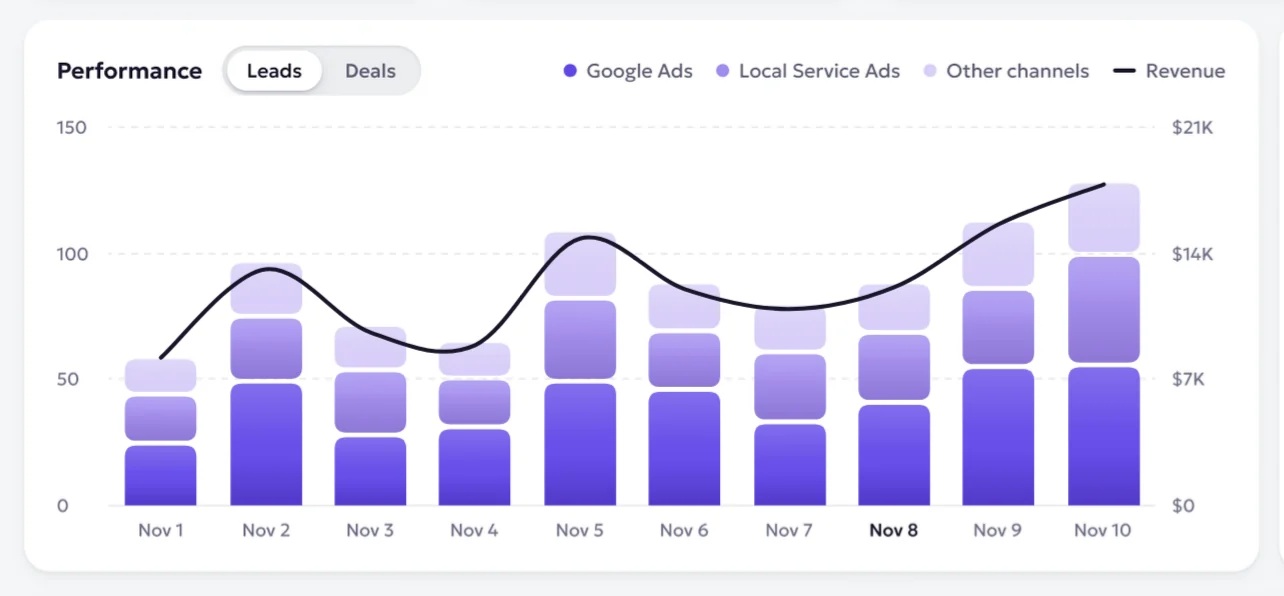
Purple is used only for data and primary actions. Lighter tints separate channels, so the chart reads without a rainbow.
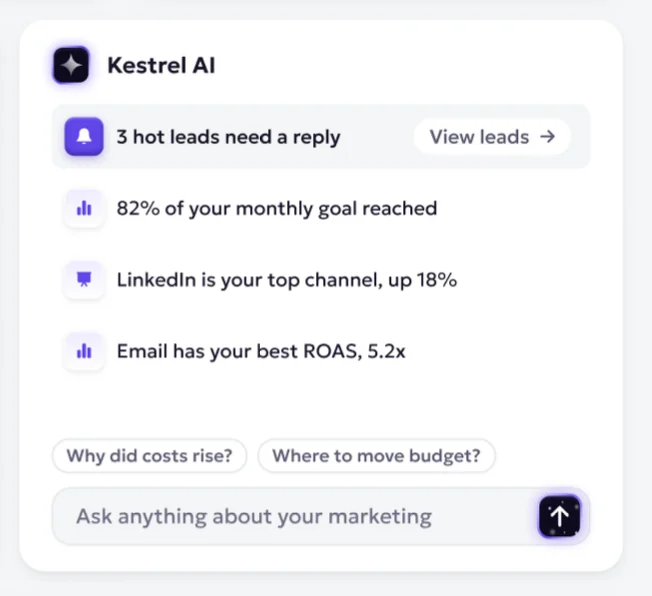
The assistant sits beside the chart it explains. It opens with findings, not an empty prompt.
One screen for the daily check. The layout follows the order people ask questions: how much, from where, what now, and which campaign.
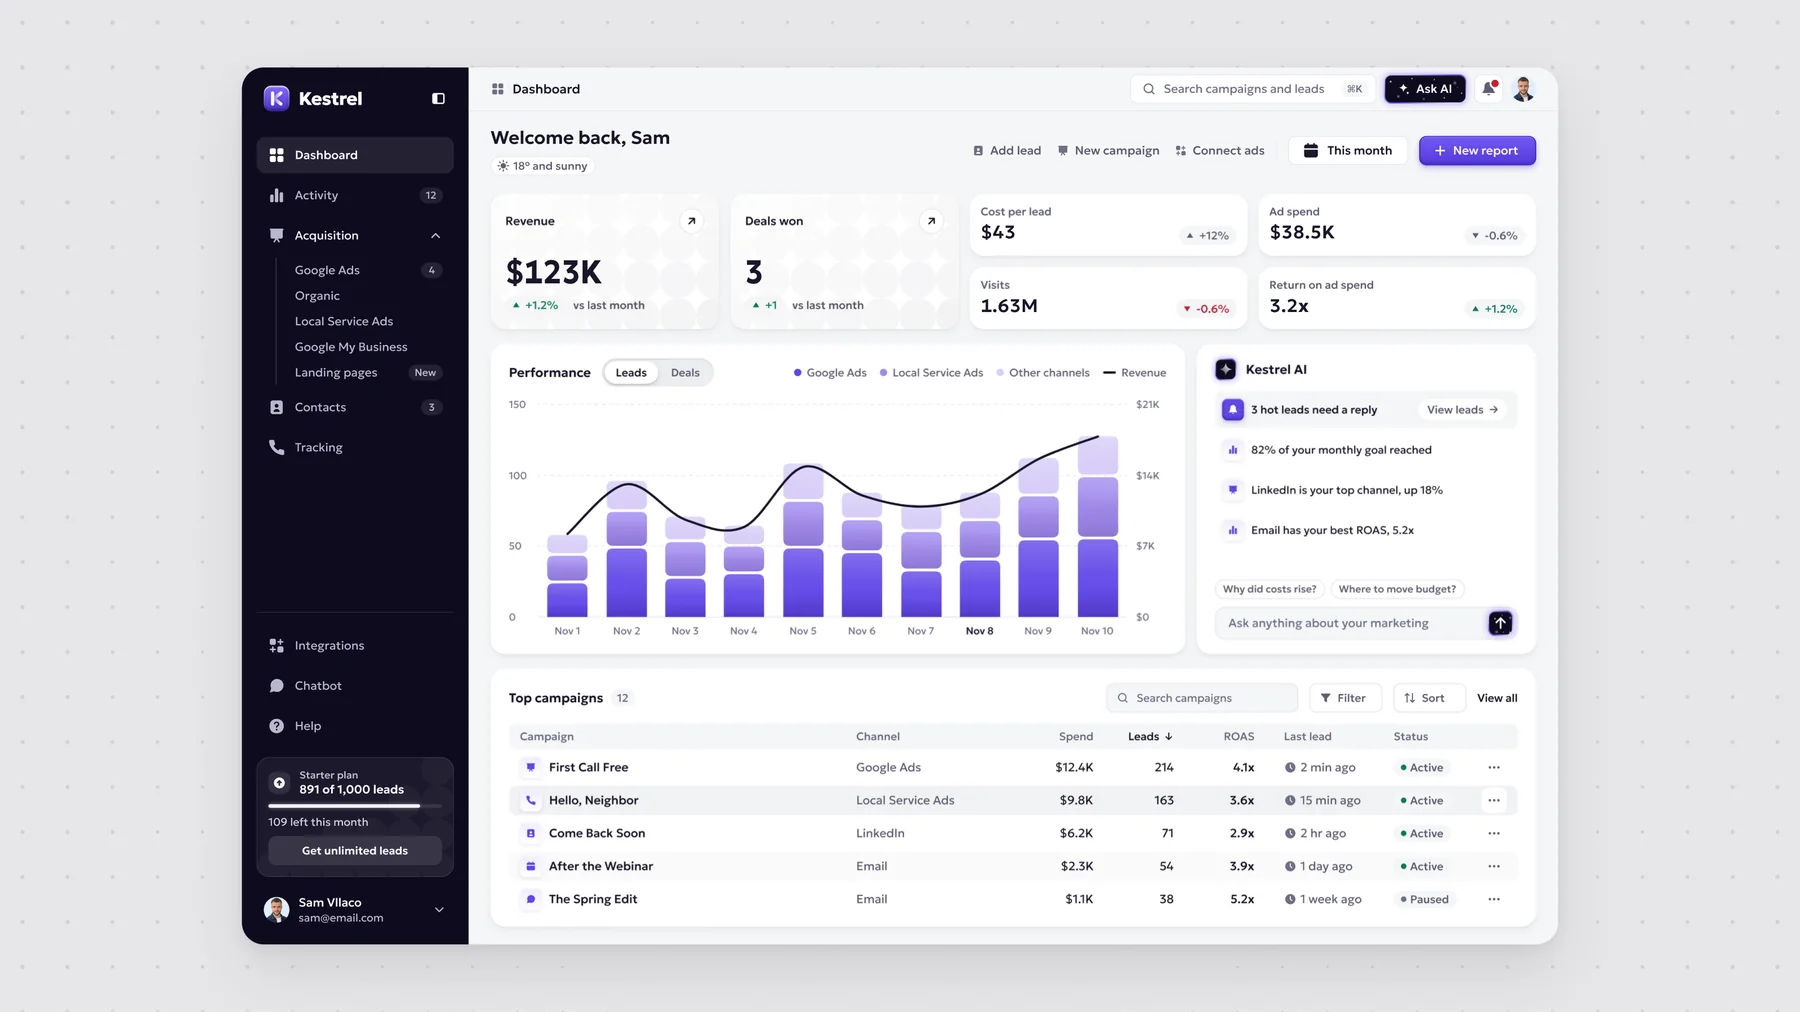
Two large cards for revenue and deals won, four compact ones for cost per lead, ad spend, visits and return on ad spend. Green and red are used only for the change, never for decoration.

Stacked bars show leads by channel in three tints of one color. A single dark line adds revenue on the second axis. The current day is the only bold label.
The panel leads with what changed: hot leads waiting, progress to the monthly goal, the top channel. Suggested questions sit above the input, so nobody faces a blank box.
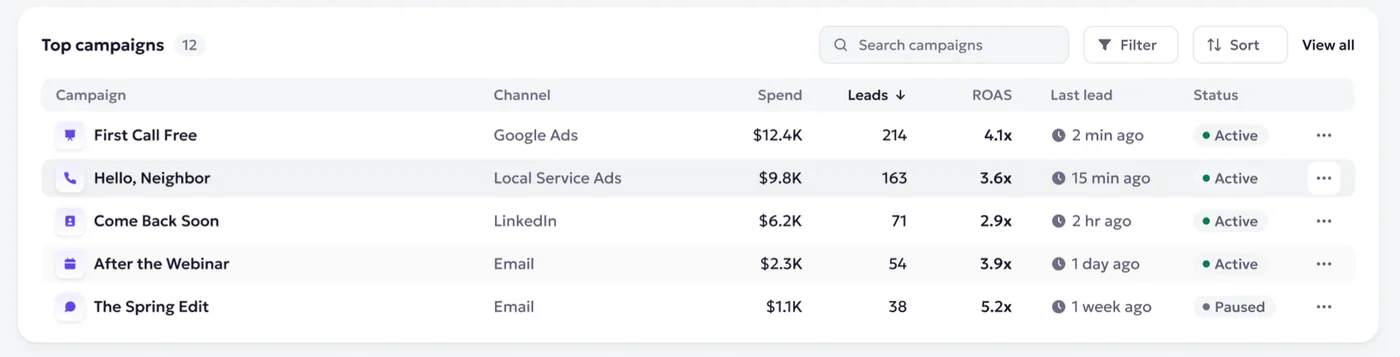
Numbers are right aligned, the sorted column is marked, and status is a small dot with a label. Each row ends with one menu for every action.
The second screen connects performance to people. It shows who the leads are, where each one stands and who is waiting for a reply.
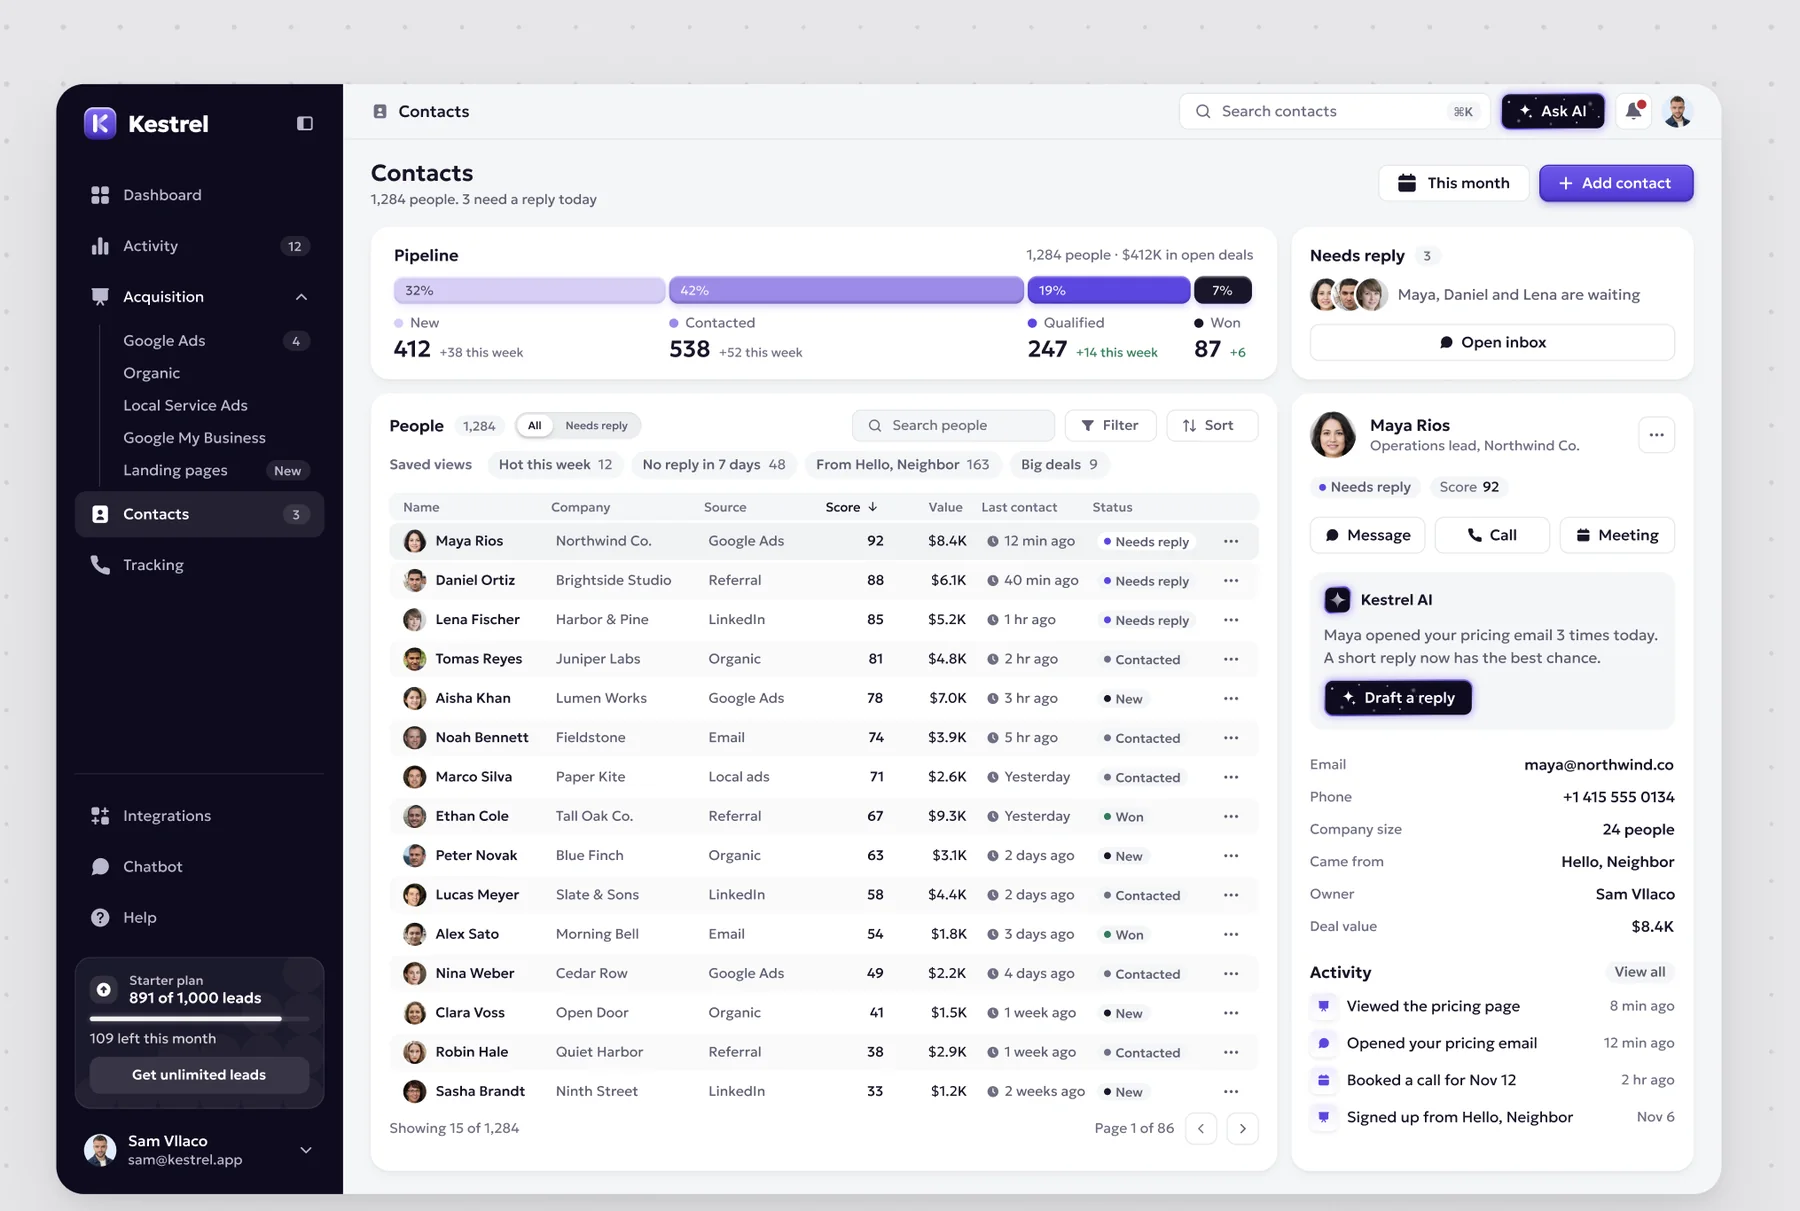
Four stages share a single bar, so the proportions are visible before you read a number. Counts and weekly change sit directly under each stage.

The lists people need most are one tap away: hot this week, no reply in seven days, big deals. The table is sorted by lead score by default.
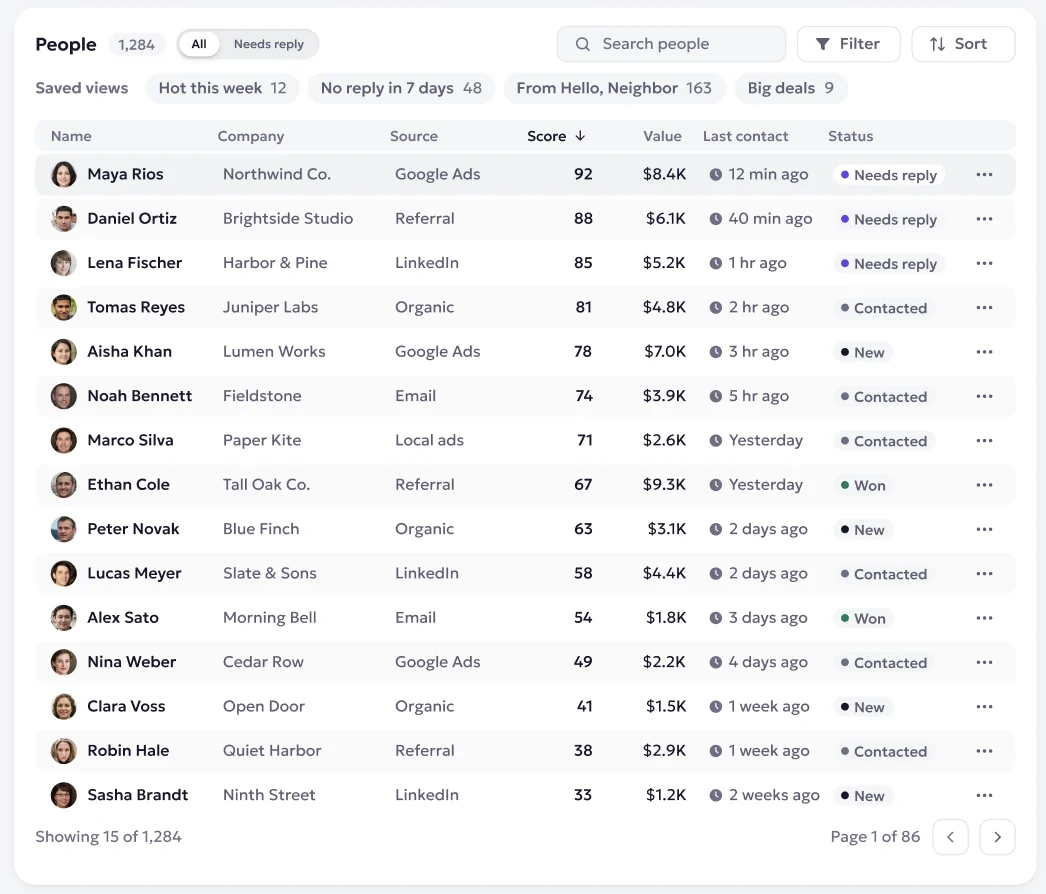
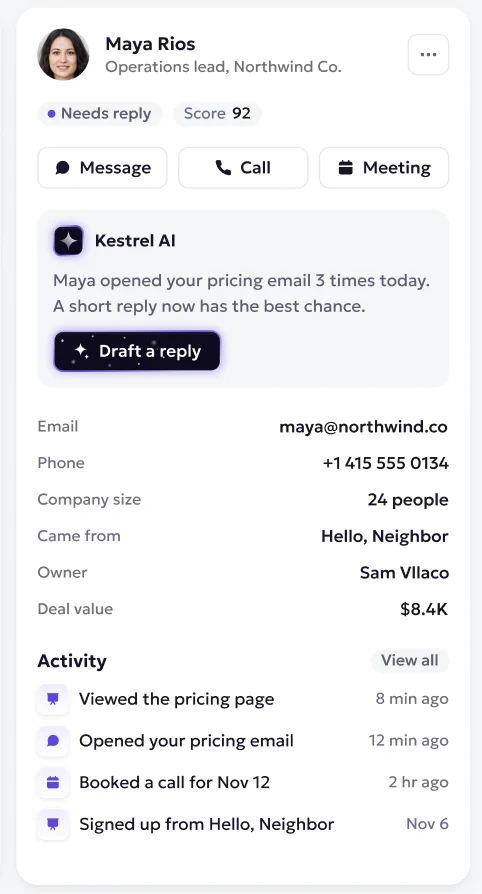
Selecting a person opens their details beside the list. The assistant explains why now is a good moment and offers to draft the reply.
Motion is used to explain, not to decorate. When the dashboard loads, cards fade in from top to bottom, numbers count up to their value, bars rise in order and the revenue line draws across them. The assistant panel gets a soft glow, the only element that asks for attention.
A small set of rules keeps both screens consistent and makes new screens fast to design.
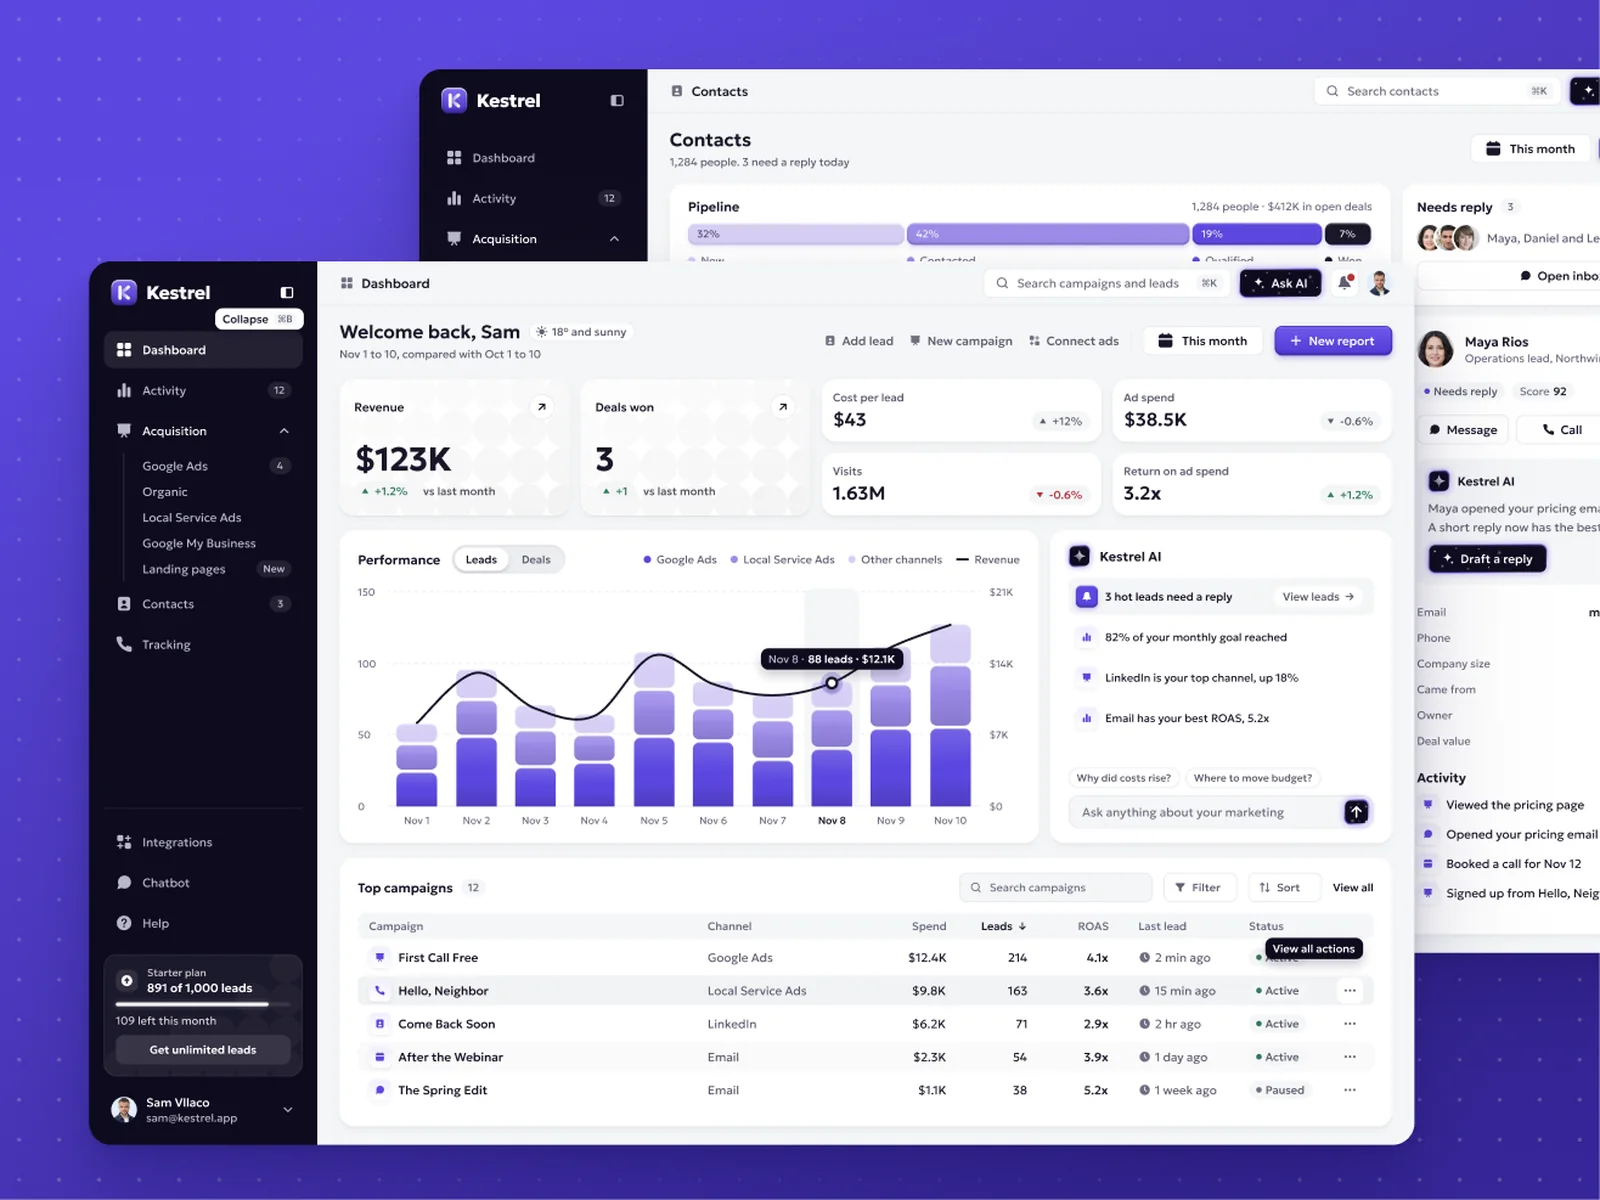
A near-black sidebar, white cards on a light gray canvas, and one purple for data and primary actions.
Geologica throughout. Large bold figures for money, small medium labels for everything that explains them.
Soft 12 to 16 pixel corners and thin borders. Depth comes from layering, not heavy shadows.
Cards, chips, table rows and buttons are shared by both screens, so they feel like one product.
I design SaaS products, dashboards and AI features that people understand on the first screen.